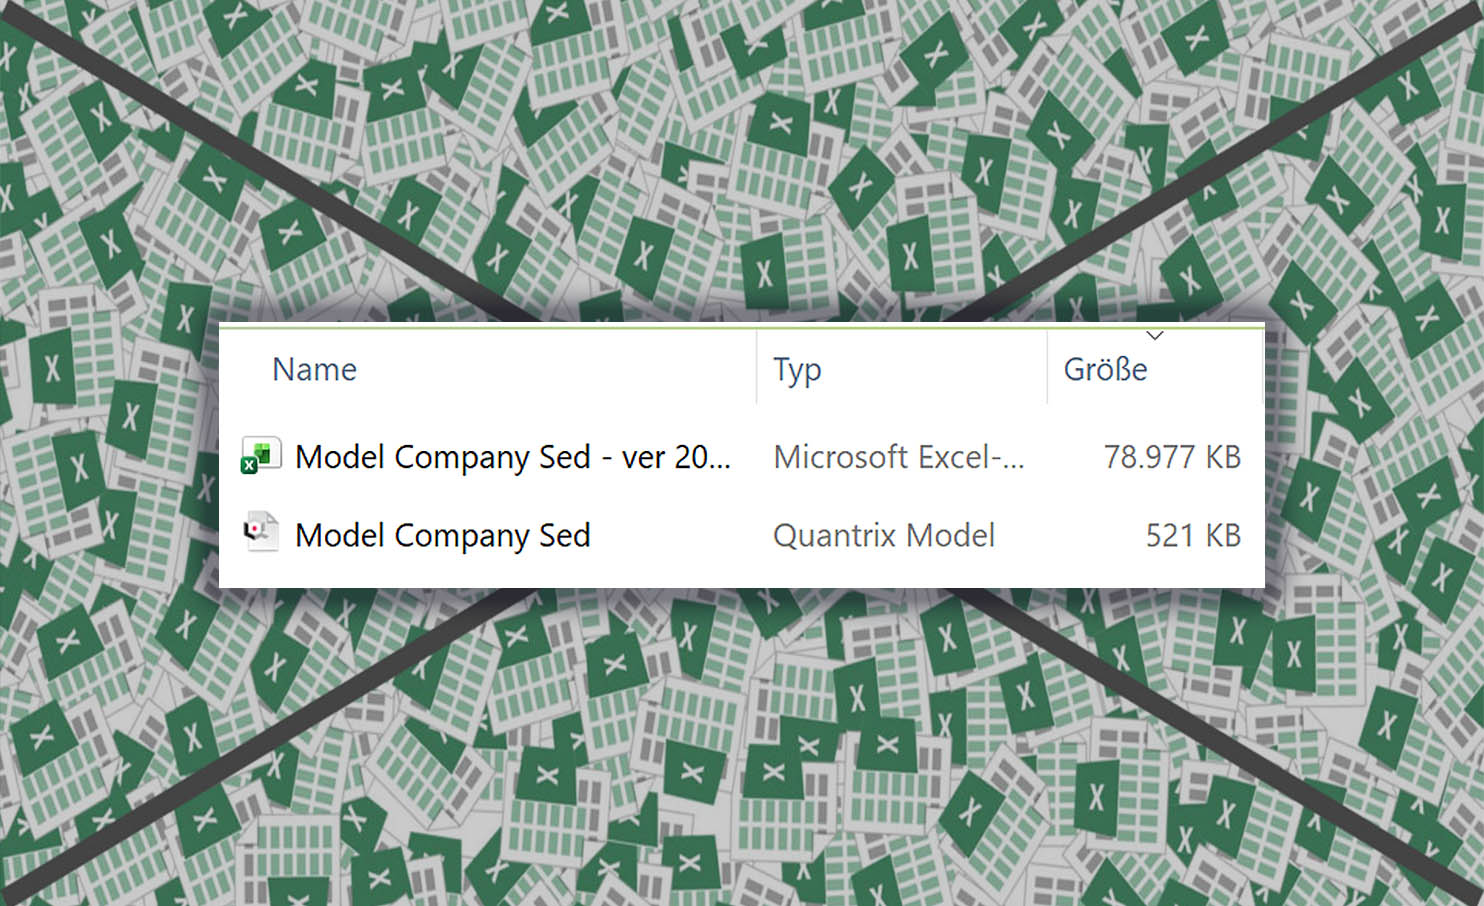
Quantrix Modeler lets you work with truly multi‑dimensional data — with always‑on pivoting that lets you slice, dice, and reshape data instantly. The single matrix shown on video, for example, replaces 128 Excel sheets, eliminating complexity and errors.
Explore your data without breaking formulas or creating endless copies of the same file. Quantrix turns complexity into clarity.
With Quantrix, you can write formulas in natural language instead of Excel formulas with cryptic cell coordinates. This makes your formulas easy to understand and audit.
Autocomplete helps you write formula faster. You have access to all the functions that Excel offers and more.
In Quantrix, you do not place formulas inside each cell. You write the formula once, separately, and it applies across the matrix.
In the video, one formula calculates the gross margin percentage for every Port, Year, Month, and for both Actual and Plan data. This eliminates the need to write thousands of formulas as in Excel, which is a major advantage for large models.
Quantrix matrices have a connected structure. This example shows how adding a new Special Scenario in Assumptions automatically updates the Sales report.
You do not need to copy and paste items from one table to another like in Excel. This keeps your model structure consistent and error-free.
With Quantrix, you can work with millions of cells in one model without compromising speed or accuracy. Quantrix files are much smaller than Excel files for the same calculation. For example, a 79 MB Excel file can be reduced to only 0.5 MB in Quantrix due to the much more efficient modeling. Plus, you can easily create and manage different scenarios or versions of your model and keep them all in one file.
Quantrix is the ultimate tool for complex calculations and data analysis.

With the Dependency Inspector tool, you can easily see how each cell in your model is calculated and understand the logic behind it. This tool helps you to present your model confidently at your business meetings and explain how the numbers are derived.
The Dependency Inspector tool is a powerful feature that enhances the transparency and accuracy of your model.

With our amazing feature, you can easily see who did what and when on your model. No more guessing or confusion!
Our Audit Trail tool records all changes to data and structure, so you can always go back and review them. Plus, you don't have to worry about documenting of changes to your model, because it is done automatically. And if you are working on a shared model file, you can use our Control tool to manage access and permissions.

You can create amazing dashboards and reports with Presentation canvas. Just add your chart, data, images, interactive sliders and other widgets to the canvas and customize them.
You don't have to worry about updating your reports manually, because they will reflect the latest changes in your data automatically. With Presentation canvas, you can tell the story of your data in a visually appealing way that will impress your audience.

You can build daily forecasts, monthly or quarterly budgets, as well as long-term plans. You can do financial consolidation, run profitability analysis. Quantrix allows you to create interactive reports and dashboards.
Yes, you can import csv file and export to xls file. You can also save your report als pdf file. You can connect to sql database and import or push data.
Desktop application Quantrix Modeler costs 2600 USD per year and user (as of Jan 2025). For Quantrix Qloud pricing please contact us.
This website uses cookies to ensure you get the best experience on our website. Learn more